The last two weeks I've been in the midst of a move, soon to take on the mantle of Dean [edit: I'll be Dean of Academic Support services, including responsibility for the library, IT, IR, faculty professional development, and service learning] at a small urban HBCU. I've gotten to enjoy the three things I enjoy least: moving, painting, and plumbing. The biggest moving challenge was around 200 boxes of books, half taken from the lovely library (pic) I built only a few years ago. The contractor hasn't been returning my calls, so it may be a while before the new one is built.
I've tried twice now to get a new driver's license, but the DMVs were full to bursting, and I'll have to get there first thing in the morning or else spend the day waiting apparently. I always keep a book handy for such occasions. It used to be A History of Western Philosophy by Bertrand Russell--the only such history I've enjoyed reading. Now I keep The Prince by Nicolo Machiavelli in the car. Both can be browsed easily. Lately I've been toting around a book I found while unpacking, called The Evolution of Cooperation by Robert Axelrod (wiki). I had bought it years ago when I did a session for high school counselors during a seminar on ethics. Most of the other sessions were touchy-feely. Mine addressed cold war strategies and TIT FOR TAT, a game theory strategy that Axelrod makes much of. I recommend the book, and while you're at it, The Selfish Gene (wiki) by Richard Dawkins, which addresses game theory in the context of biological evolution.
The argument is made that in relationships with others, the most robust (or at least one very robust) strategy is to have a short memory about past interactions, and to reciprocate immediately both cooperation and betrayal (called defection in the book). In terms of the workplace, this could be something as simple as being honest with co-workers. [aside: I always put the hyphen in co-worker, because otherwise it might be interpretted as cow-orker. I'm not sure what that is, but I wouldn't want to be one!] If initial trust is reciprocated, then the relationship works to the advantage of both parties. On the other hand, if someone is less than honest, TIT FOR TAT would have you reciprocate. In this case, probably not by returning the same behavior, as that would ultimately be self-defeating, but by exposing the behavior or otherwise addressing it head-on. One of Axlrod's main points is that reciprocity of negative acts can 'echo' in destructive cycles. Think of acts of ethnic-based violence, for example. He gives insightful examples of life in the trenches of WW I, where opposing units would often come to implicit terms of temporary truce. Violations of the truce were dealt with immediately and harshly.
One of the most interesting results from game theory is that in short-term relationships, the rational strategy is to betray (or defect). Only in circumstances where you will interact for an indefinite number of times with others does cooperation make rational sense. In human societies, this is ameliorated by the fact that our reputations follow us. But witness the behavior of people who are anonymous (as on Internet message boards) to see evidence of the unfettered behavior emerging.
Another book, this one on my Amazon wish list, is Predictably Irrational by Dan Ariely. I found an outline of it here that summarizes the main points. There are several bits here that are of interest to marketing higher education. These have to do with price and perception. The first is the power of comparison. An example is given of a bread-maker that wouldn't sell until the manufacturer came out with a 'deluxe' model, which made the basic model seem like a bargain. At the same time, higher prices are associated (arbitrarily, it seems) with more value. One institution I consulted for raised its tuition dramatically over three years just to be in the same league as the ones it aspired to be. That is, the increases were not financially motivated, but for marketing purposes.
The second chapter--on anchoring--has some powerful lessons for marketing higher ed, I think. Again, the theme is perception becomes reality. Black pearls are worthless until they're stuck in a pricey display window with a ridiculously high number on the tag. Since perceptions of prices in higher education are already high, the strategy would be driven by competition locally or within a niche. The lesson of Starbucks (given as an example) is to create something that's the same but looks new--to create new expecatations of price and experience. If there's a recurring theme, it's that perception drives experienced reality.
Finally (for this post), there's the idea that 'free' is often overpriced. That is, people often value something that's putatively free disproportionately over merely cheap. Amazon.com's free shipping is an example of a success story. Free online applications to college (waiving the normal fee) could be another. At my new university, students get a 'free' laptop--never mind that they pay a hefty technology fee. It makes me wonder what else we could package that way...
Wednesday, December 31, 2008
Thursday, December 18, 2008
Challenges with First Generation Students
We've run an attitude and behavior survey for the last three years, which distinguishes on one item whether or not a student's parents attended college. Testing means on the other items using this as the key yields some interesting characteristics. Sample size is around 350 of each type.
First-generation students are less likely to be happy with campus conditions, quality of instruction, use the library, like the general education curriculum, read for fun, have a mentor, or say that tuition was worth it. They have a lower assessment of their thinking and communications skills. They are more likely to cite detrimental family influences on studying, say that money problems might cause them to drop out, and have chosen the college as their first choice. The picture of first-generation students is one of generally unprepared for the financial, culture and intellectual requirements of the academy.
Plans to deal with this division are well under development. Interestingly, I got an email today about a similar plan already implemented at Manchester College, a private school in Indiana. I found the article online here. The elements are the same as the one we are developing: assure parents and students of a successful transition to and through college into the workplace (or graduate school). Their students are probably more prepared than ours, judging by their graduation rate. We have the additional challenge of bridging the cultural capital gap for the first-generation students.
Elements of a successful plan probably include addressing marketing (internal and external), adjusting financial aid policies to include continuous review, academic support services, adjustment of the curriculum (to rebrand the liberal arts, in our case), and career development. In our case, it's particularly hard to market a liberal arts product to first-generation students who have no idea what those words mean. A major part of the plan is repackaging those ideas in a more understandable way. It also requires an honest re-think on our part, asking if we are really delivering what the implied promises are.
Wednesday, December 17, 2008
Content Management and Portal Intergration
One of the biggest headaches for any reporting unit like institutional research, is maintaining web sites that push out information to constituents. On a bigger scale, the whole institution has a similar problem. Nowadays a content management system (CMS) is pretty much required to maintain sanity. These packages, like drupal or joomla (both open source), will help separate design from content--a big step in the right direction. But that still leaves the problem of generating reports (often dynamically) and getting them on web pages in a suitable format.
In the past I've relied on custom code for this sort of thing, but that is not maintainable past a certain scale. So I was interested to read an article in Campus Technology about a product called bluenog that integrates a CMS with reporting functions (they call it business intelligence, but it looks more like reporting to me) and a portal designer to boot, all integrated. The demo videos look interesting, but don't give a lot of detail. I found a review here (which led me off to read about other interesting web 2.o worksavers like this). The Bluenog company has an interesting business model--they sell you the software, but then give you the source code. I'm downloading it to give it a spin tonight. It's over 700mb for the full (trial) version.
Update: After installing the trial version of their ICE (integrated system), and playing with it for a while, I think it's more complicated than what I'm looking for. I can see using this in a very large installation, but my head is swimming at the development complexity of the thing. Maybe I've misjudged it, however, and will continue to play around with it for a few days.
Tuesday, December 16, 2008
Gloom and Doom for Traditional Universities?
There's an interesting article at WebWire that I found linked to U. Bus. predicting the end of the traditional model of universities. This is predicated on the existence of disruptive technologies, that the higher ed industry is mature and incapable of much innovation, and that it is currently overpriced. The following quote attributed to Peter Druckeris is cited from Forbes:
Anyone who's ever served on a committee will not find it hard to believe that higher education as an industry is not going to change overnight. A study from The National Center for Public Policy and Higher Education and Public Agenda called The Iron Triangle (pdf), which seeks to illuminate the gearworks of change in higher education. The authors quickly get to a central problem: "The various stakeholders must agree on the definition of the problem." Moreover, principles (according to the article) are locked into a mentality of thinking of cost, access, and quality as forming what mathematicians would call a partition--improving one variable necessarily has adverse effects for the other two. It's a zero-sum game, in other words. The stakeholders do not necessarily hold the same view--the industry is seen as bloated an unresponsive. Within the report are found comments by presidents on the subject of cost, access, and quality. These are very interesting and highly recommended for reading in detail.
Not all presidents bought the premis of the iron triangle. Here's a quote from one president, which resonates in light of current events in the auto industry:
What if the market for the best students has become more liquid, driving up their price? That would mean that for the same cohort of talented students, universities generate less revenue from them because they're bidding against each other. Who makes up the short-fall? Costs can get pushed down to the need-based crowd, which is what's been happening (see practically any issue of Opportunity for such an argument). This has been enabled by cheap money. So the combination of aid leveraging for talent and easy money could be part of the answer. It would be very interesting to see the financial aid matrices for various institutions over the last ten years, to see how they've evolved.
Thirty years from now the big university campuses will be relics. Universities won’t survive. It’s [Internet technology] as large a change as when we first got the printed book…The cost of education has risen as fast as the cost of health care…Such totally uncontrollable expenditures, without any visible improvement in either the content or quality of education, means that the system is rapidly becoming untenable. Higher education is in deep crisis.As an example of things to come, the author gives us Andrew Jackson University's 'sponsored tuition' program. It's a fascinating idea--pay for the marginal cost of instruction for those students through commercial sponsorship. Here's a quote from AJU President Don Kassner, taken from Wikipedia:
Most universities spend a tremendous amount of money to recruit students. Many spend as much as thirty-five percent of their revenue on marketing and advertising. They have to keep their tuition high to recover these costs. We eliminated these costs by structuring relationships with strategic partners that refer potential students to us. Therefore, we can operate a quality, degree granting institution without the escalating tuition and excessive fees deemed necessary by many schools.That's a glimpse of the disruptive technologies part. What about inflexibility of the current system?
Anyone who's ever served on a committee will not find it hard to believe that higher education as an industry is not going to change overnight. A study from The National Center for Public Policy and Higher Education and Public Agenda called The Iron Triangle (pdf), which seeks to illuminate the gearworks of change in higher education. The authors quickly get to a central problem: "The various stakeholders must agree on the definition of the problem." Moreover, principles (according to the article) are locked into a mentality of thinking of cost, access, and quality as forming what mathematicians would call a partition--improving one variable necessarily has adverse effects for the other two. It's a zero-sum game, in other words. The stakeholders do not necessarily hold the same view--the industry is seen as bloated an unresponsive. Within the report are found comments by presidents on the subject of cost, access, and quality. These are very interesting and highly recommended for reading in detail.
Not all presidents bought the premis of the iron triangle. Here's a quote from one president, which resonates in light of current events in the auto industry:
Years ago I heard a speaker from the auto industry who asked, ‘WhatMaybe. I think it's a little more complicated than that. Here's one idea to consider.
happened to the auto industry in the 1970s? It wasn’t bad design. It wasn’t
planned obsolescence. It wasn’t unions. Fundamentally, it was hubris. It was
a belief that the American automobile industry had always built the best
vehicles, always would, and that the public would buy whatever we built.
We saw our problem not as a product problem, but as a marketing problem.
What if the market for the best students has become more liquid, driving up their price? That would mean that for the same cohort of talented students, universities generate less revenue from them because they're bidding against each other. Who makes up the short-fall? Costs can get pushed down to the need-based crowd, which is what's been happening (see practically any issue of Opportunity for such an argument). This has been enabled by cheap money. So the combination of aid leveraging for talent and easy money could be part of the answer. It would be very interesting to see the financial aid matrices for various institutions over the last ten years, to see how they've evolved.
Friday, December 12, 2008
Education Feeds
I had some more fun with yahoo pipes mashed up with a google docs spreadsheet, to take the top two RSS feeds from five higher ed news sources, and embed them below. It's not beautiful, but it's live (will update when the feeds do). I'll work on it some more to improve the asthetics, when I get a chance. Sources: insidehighered.com, New York Times, The Chronicle of Higher Ed, Wired, and University Business.
I got started using this blog.
I got started using this blog.
Thursday, December 11, 2008
Virtual Loans
I mentioned an idea in the last post about institutional loans. A better word might be virtual loans because the money doesn't really exist until it comes due. That is, it's a loan with no capital at risk. You'd think this would get the attention of a bank or two, but in these times who knows.
Direct loans from the government are limited in amount, and subject to other kinds of restrictions. Loans in general are likely to be harder to get for students in the current climate. I've argued that the easy money of the last decade has allowed tuition to rise in its own bubble along with housing, and that there will be a return to Earth in short order. Virtual loans are possibly a way to ease this pain.
Here's how it works. Most institutions give out institutional aid that is a simple discount from tuition. We don't ask anything in return for this discount, and it's used to get students with the kind of ability we want to attend, or (to a lesser extent) help students who can't afford the cost. For the latter group particularly, it's probably a good idea to tie the aid to student work. This helps alleviate the need for part-time workers, and gives the students a point of engagement with the institution that should help with their retention. But I digress.
Instead of a no-strings grant from the institution, why not ask for something? Work study is one idea, but there are lots of others. Future participation in alumni activities, recruiting, etc. are some ideas that could be the strings attached. Another one is repayment for a part of the total aid. That is, the institution "loans" the student money to make up part of the tuition instead of granting it directly. Since this money never really exists, the terms of what I'm calling a virtual loan could be quite generous. How about a zero-percent loan, deferrable two years after graduation, and paid out over 10 years? Even if many of these default, this program only has to pay for its own administration in order to break even, since there's no real capital at risk. The goal would be to provide a future revenue stream with no present capital outlay.
Even better would be to involve a bank in the processing of the virtual loan. Banks do loans all the time (well, they used to, and this will give them something to do). They have the regulatory infrastructure in place, and are set up to receive payment with no additional bureaucracy needed. This should lower the administration cost. If you know a banker, ask him or her on what terms would he or she loan money at no risk.
There may be some legal reason why this all can't happen. I should have opportunity in the near future to explore this idea with people who know more about the regulations than I, and I'll find out if this idea is feasible. Maybe someone is already doing it. The virtual loans wouldn't do anything to alleviate the current financial woes, but would start to create a new long-term revenue stream that would start to pay off in a few years. With judicious planning, an institution could be audacious enough to eventually offer these kinds of loans to the extent that they replace traditional loans, and thus secure a favored place in the market. That is, if the virtual loans were managed so that they push out more traditional loans, it would be very attractive to students because of the much lower interest rates. This could only happen by institutions weening themselves off of the interest-bearing loans over time, but in principle there's no reason for that to be impossible.
The fact that virtual loans are not ubiquitous seems to me to be an inefficiency in the marketplace. But it may be that the conditions for such loans are not favorable enough to warrant the administrative costs. If the default rate is near 100%, for example, it might create more problems with alumni (who often voluntarily give money) than it is worth.
Wednesday, December 10, 2008
Financial Aid Woes
The front page of InsideHigherEd this morning has an article about Syracuse University, and the impact of the financial climate on student appeals for financial aid.
What to make of the plea to alumni for additional aid? This looks like a short-term emergency response, and as such might be quite reasonable. I would also argue, however, that they should also be taking a hard look at their leveraging model. All of us who give institutional aid in order to shape incoming classes will have to do the same. The basic calculation, is: what do you gain by letting these students walk out the door? With an average net revenue (tuition-institutional aid) of $15,443, the price tag would be almost $6.2M if all 400 left. Assuming that the requested additional $2M in aid is the right number to keep these students, it seems fairly obvious that the university is better off creating the aid out of thin air if it can't get the donations, rather than letting students drop out for financial reasons. Adding 2M to a 155M aid budget would be a small price if that's the total impact of this recession.
The article also mentions loans and the inability of students to get them as an impediment to attending. I tested my idea about institution-based loans with our Business VP yesterday. It seems like an idea worth pursuing, and I'll follow up here when I get a chance.
Syracuse University recently sent an appeal to alumni warning that approximately 400 students will be unable to return for the spring semester unless the institution can raise an additional $2 million in scholarship support by the end of January 2009.They are putting out the call to donors for additional aid to bridge the gap. I tried to find a figure for the university's discount rate, and stumbled on an old self study that puts the 1989-90 rate at 10.5%, and describes the financial aid leveraging process they're putting in place.
An innovative awarding and measuring tool, based on econometric methods, factored in student academic qualifications and family financial need. This model enabled the prediction of enrollment outcomes and guided the University to a considerably more competitive pricing position. In the course of its implementation, the undergraduate tuition discount has increased from 10.5% in 1989-90 to 37.8% in 1996-97. While this approach has accounted for a considerable shift in net available revenue, it is also credited with helping to stabilize the quantity and quality of undergraduate enrollment. The undergraduate tuition discount rate is expected to level at about 38% in 1998-99 and remain there for the immediate future.That puts the rate at 37.8% ten years ago, after a dramatic-sounding reformulation of aid policies. The InsideHigherEd article quotes $16,737 as the average award, but I wasn't certain from the context if this was all institutional. Apparently it is, because the IPEDS report tool puts last year's average institutional award at $17,136. That would be a discount rate of a whopping 52%, far in excess of the 38% target. This assumes, however, that they are not including other fees and such when they calculated the discount previously.
What to make of the plea to alumni for additional aid? This looks like a short-term emergency response, and as such might be quite reasonable. I would also argue, however, that they should also be taking a hard look at their leveraging model. All of us who give institutional aid in order to shape incoming classes will have to do the same. The basic calculation, is: what do you gain by letting these students walk out the door? With an average net revenue (tuition-institutional aid) of $15,443, the price tag would be almost $6.2M if all 400 left. Assuming that the requested additional $2M in aid is the right number to keep these students, it seems fairly obvious that the university is better off creating the aid out of thin air if it can't get the donations, rather than letting students drop out for financial reasons. Adding 2M to a 155M aid budget would be a small price if that's the total impact of this recession.
The article also mentions loans and the inability of students to get them as an impediment to attending. I tested my idea about institution-based loans with our Business VP yesterday. It seems like an idea worth pursuing, and I'll follow up here when I get a chance.
Monday, December 08, 2008
GRE Trend
There's an article in insidehighered.com that says "The number of students taking the Graduate Record Examination will decline in 2008, the first time ever that the GRE has seen a fall in test-taking during an economic downturn."
I wondered what google trends would show about searches for GRE. See below.
 Interestingly, the number of searches has been averaging less and less over the years, despite the article's assertion that this was the first year they'd seen a drop in actual tests. I wondered if the results have some bias, and tested that by asking for statistics on searches for toys.
 Nope--this seems as regular as a heartbeat, with a spike every holiday season. Searches for 'graduate school' have trended down, while searchs for 'jobs' have trended up. Steak seems to be trending down a bit, while potatoes are perhaps on the rise. Try 'wedding' and 'divorce'--Atlanta seems to be hard on marriages.
Sunday, December 07, 2008
Google Trends
Would you like to know if your students or applicants are more concerned about tuition, aid, or loans this year? One global measure is how many times certain terms were Googled. Amazingly, this information is yours for the asking at google trends. You can restrict to geographic locations and time periods, and ask for several terms at once. An example is shown below, where I requested "tuition" and "financial aid" searches in the USA.
 Note how regular these patterns are. Other trends are apparent too. There are more searches for tuition than financial aid, and the latter tails off in the winter. Also, searches for both terms have increased over the last years, but not dramatically. This could be due to any number of things, and one can get an idea by searching for "best college", which also shows an increase. It's probably a good sign that the charts don't change dramatically for the current cycle. If you look at "unemployment" on the other hand, it's a different story. A report at the bottom shows which locales most frequently googled the term. Fascinating stuff, and potentially important for your marketing.
A previous post mentioned a debate about SAT. Its chart is fascinating. Whereas the search trend is to decline slightly on average, the news volume (bottom graph) is clearly trending up.
 The same thing (even more dramatically) is happening with ACT. Of course, "act" is another word that might be googled frequently, so that's more ambiguous.
As a bonus you can link to the results and export as a CSV file. From there, we could link to google documents or yahoo pipes. You could, for example, create a dashboard-type feature to show how many times your school's name was googled in your state (or was in the news), and graph it on an administrative portal beside applications received and awards granted.
Saturday, December 06, 2008
The Wealth of Majors
I've argued before that average graduate salaries would be interesting to use in program and institutional assessment. I've thought that the government ought to report out these average salaries for graduates of an institution to use as an outcomes measure. They have all that data anyway--why not use it for something? I've even made this pitch to people who work in the Department of Education, but I invariably get a stony response.
There's a report shown in the Wall Street Journal showing data collected by a private company to accomplish the same thing. Take a look and see if this isn't useful information. I wish that for comparison's sake, they'd included people who never finished college, or never finished high school.
Disambiguating cause and effect is difficult, of course. Impossible with the data shown. We don't know if MIT graduates earn more than SIU graduates because the school taught them better or the students were better to begin with, or if perhaps they settled in locations nearer their schools, which have different economies. It may say more about what kinds of people attend what kinds of institutions and major in what kinds of subjects than it does about the effectiveness of a program of study in the eventual production of wealth. Still, this kind of information is useful for parents and students considering their options. The fact that median salaries for philosophy majors is slightly more than that of marketing majors makes me happy.
If the government really were to do such a study, using tax records, financial aid data, and clearinghouse data, some clever person might be able to find a control group in order to untangle causes and effects. A good salary shouldn't be the sole end of education (see this book on that topic), but it's an important factor, and undoubtably useful.
Friday, December 05, 2008
Yammer
I heard about Yammer the other day on NPR's All Tech Considered segment. It's like twitter, except for the workplace. Some people swear by twitter, but I haven't been able to see the use of it myself, given the time investment seemingly required. (I know--I probably just don't get it.) Anyway, yammer seems like a solution to a problem.
What problem? Well, spam in short. Not the external kind that clogs up the Internet in general, but internal spam. At a large enough institution, it's an example of a tragedy of the commons. Way more than half of my emails are stuff I don't particularly want to read. If it were tagged with a minimal amount of meta-data then it would be much more useful to me. For example if a message came with standard tags I could instantly decide whether or not I'm interested in reading it. Better yet, if I could just let it blow by without even entering my In-Box, so much the better. That's essentially what yammer does. It's like sending out a chat on a group channel, but with meta-data possibilities. It's simple to embed a tag: just use a pound sign. For example:
There is a desktop application that's very pretty. It runs on Adobe's AIR platform. A picture is shown below.
 It's very pretty, as you can see.
Is this really a company-wide spam killer? That remains to be seen. I'll first test this in my areas of responsibility and see how it works. With any luck, others will become interested too.
Yammer is free for basic functionality. If you want more administrative functions, you have to pay.
Edit: I can already tell this isn't really a tool to eliminate much internal spam. It generates more traffic if anything. It's for a different purpose, and I will explore this (you can actually see what the creators envision on a short video on their site). I'm thinking that perhaps posting mass mailings to a portal message board is the solution to the spam problem.
What problem? Well, spam in short. Not the external kind that clogs up the Internet in general, but internal spam. At a large enough institution, it's an example of a tragedy of the commons. Way more than half of my emails are stuff I don't particularly want to read. If it were tagged with a minimal amount of meta-data then it would be much more useful to me. For example if a message came with standard tags I could instantly decide whether or not I'm interested in reading it. Better yet, if I could just let it blow by without even entering my In-Box, so much the better. That's essentially what yammer does. It's like sending out a chat on a group channel, but with meta-data possibilities. It's simple to embed a tag: just use a pound sign. For example:
Trying to learn the yammer API #webwould tag the message with the web keyword. Users could elect to follow that thread, or even create an RSS feed from it. There are also groups. I'm not sure what the relative advantages are of the two options, other than that groups can be made private.
There is a desktop application that's very pretty. It runs on Adobe's AIR platform. A picture is shown below.
 It's very pretty, as you can see.
Is this really a company-wide spam killer? That remains to be seen. I'll first test this in my areas of responsibility and see how it works. With any luck, others will become interested too.
Yammer is free for basic functionality. If you want more administrative functions, you have to pay.
Edit: I can already tell this isn't really a tool to eliminate much internal spam. It generates more traffic if anything. It's for a different purpose, and I will explore this (you can actually see what the creators envision on a short video on their site). I'm thinking that perhaps posting mass mailings to a portal message board is the solution to the spam problem.
Cost of College
There's an article in the New York Times about the decades-long rapid increase in the cost of higher education. Another one is on cnn's website. Both refer Measuring Up 2008, The National Report Card on Higher Education (pdf) from the National Center for Public Policy and Higher Education. In the Times article, the Center's President is quoted saying:
 In 1995 our tuition was $10,488. Now it's $18,792, but discount rates have increased too. Leaving that detail aside, it would be an increase of around 79%, or 4.6% per year average. The graph shows an increase of about 293% in the same period, or 8.6% per year. The point of this is that the averages conceal considerable variety.
Loans increased by over 100% in the last decade, according to the report (Stafford Loan borrowers increased by 50%). This leads naturally to the speculation that tuition prices have been inflated by the credit bubble along with housing. With loans harder to get, the grim calculus isn't hard to compute: some combination of fewer students enrolled and lower net tuition paid. This will reduce net revenue to many institutions.
What to do? Undoubtedly, there are efficiencies to be found at any institution. The luxury of NCAA division II (scholarship athletes) will be under pressure. Division III nominally has no athletic awards, which adds up to a lot of money quickly. Other ideas include:
The report, “Measuring Up 2008,” is one of the few to compare net college costs — that is, a year’s tuition, fees, room and board, minus financial aid — against median family income. Those findings are stark. Last year, the net cost at a four-year public university amounted to 28 percent of the median family income, while a four-year private university cost 76 percent of the median family income.I found median family incomes by state here, and looked up our state to find that it's about $53,000. According to the statement above, a private university would have a net cost of around $40,000. We're nowhere near that. In fact, family contributions are less than a quarter of that figure. But we have also not raised tuition much in the last decade--certainly nothing like the graph shown in the article (reproduced from the original report below).
 In 1995 our tuition was $10,488. Now it's $18,792, but discount rates have increased too. Leaving that detail aside, it would be an increase of around 79%, or 4.6% per year average. The graph shows an increase of about 293% in the same period, or 8.6% per year. The point of this is that the averages conceal considerable variety.
Loans increased by over 100% in the last decade, according to the report (Stafford Loan borrowers increased by 50%). This leads naturally to the speculation that tuition prices have been inflated by the credit bubble along with housing. With loans harder to get, the grim calculus isn't hard to compute: some combination of fewer students enrolled and lower net tuition paid. This will reduce net revenue to many institutions.
What to do? Undoubtedly, there are efficiencies to be found at any institution. The luxury of NCAA division II (scholarship athletes) will be under pressure. Division III nominally has no athletic awards, which adds up to a lot of money quickly. Other ideas include:
- Instead of direct institutional aid, require some work-study for the money. This saves on part-time employees.
- Instead of direct institutional aid, make institutional loans. I don't know of anyone who does this, but it worked well for GM for a long time. Small institutions could form a consortium for this. The way it would work is to loan students money with repayment starting at some point after graduation. The money loaned isn't real--it's just discounted tuition, so no real money changes hands until repayment. There are probably legal issues here I'm not aware of, but it would alleviate the loan crunch and also let colleges eventually generate interest from these loans. Maybe later on they can divide them up into tranches and sell credit swaps (just kidding).
- Add or increase after-work classes for working adults. The infrastructure for a college or university is large and expensive. Using classrooms at night and hiring instructors is a small additional cost for the additional revenue generated. Flexibility in tuition structure can make it easy to meet demand with supply.
- Online classes are trickier because of the competition. This may or may not be a good investment for the institution, but even traditional or evening classes can be made more efficient by using a hybrid approach. If some of the class meetings are online, there are additional types of learning opportunities, as well as the potential to reduce some costs and make it more convenient for commuters.
Tuesday, December 02, 2008
Dehne Visit Notes
We had a visit from consultant George Dehne of GDA Integrated Services today. A lot of what he said resonated with our retention research that led to the Plan 9 project. Specifically, he said that first-second year attrition is generally a sales problem, and after that it's programs. A small rural liberal arts college has three strikes against it, according to Dehne, because the so-called Millenial student is looking for an urban experience (lots to do), doesn't care much about size, and doesn't understand what liberal arts is (maybe it involves crayons?). To underscore the second point, he said that their research tells them that 65% of applicants don't know how big the institution is that they're applying to. But generally, preferences for size have grown from an ideal of 2500 ten years ago to about 6500 now.
One of their specialties is finding a distinctive element (big idea) around which to rally marketing and delivery of the educational product. The big idea is the project of brainstorming, involvement with the institution, and market research. I think we're capable of doing most of the first two parts, but aren't in a position to do our own market research. Part of the idea there is to cast a large net and find out what part of the college-bound pool isn't applying to our institution. Maybe we're missing part of our ideal market. The other part is to test out these
"big ideas" before adopting one, to make sure it really works.
One interesting idea that worked at another school was re-branding the core requirements as a major--every student has two majors (they value majors, and don't value 'general education', being the hypothesis). Another interesting idea was having first year seminars on topics like The culture and history of football.
Saturday, November 29, 2008
How to Make it Last
I just finished an article Survival Strategies (pdf), which is a theoretical examination of how something--anything--can survive an indefinitely long period. There are some practical bits of wisdom to be gleaned from this for higher education or any business enterprise.
First, longevity requires one to 'be many' or 'be smart.' The former case works well for biological life, which can multiply and fill every evolutionary niche available. The latter is the only strategy open to an individual subject. It has to constantly work to increase its probability chances in two ways.
External threats and opportunities have to be anticipated in order to be successful. This means doing something like science: observation, experimentation, and creation of inductive hypotheses. The more you understand and can predict and control the environment, the better your odds are.
The second way in which an organization needs to improve its odds is internal. There is always some chance of self-destruction. For a college this might mean the decision to close the institution down because of lack of funds. It's hard to imagine an institution doing this except out of necessity, but there are other ways in which it can become self-destructive. As a case in point, this article describes a nearby college that made some bad decisions about who to let manage its endowment.
The point is that in addition to being able to anticipate and take advantage of external conditions, an institution ought to be continually striving to make its decision-making better as well. We see bits and pieces of this with an emphasis on assessment, TQM, and the whole idea of institutional effectiveness. We audit expenses assiduously. Why don't we audit decisions? If there were such a thing as documentation and retrospective analysis of decision-making, it would lead to better decisions down the road (my opinion). It's the difference between being curious and self-reflective and being stubborn and blind to the past. We would probably accept this description for individual humans, but it's not commonly discussed, in my experience, for institutions.
Update: The paper is now on the arXiv science preprint server here.
Thursday, November 27, 2008
SAT Redux
I'm teaching an Introduction to Statistics course this term, and we just did linear regression. I used the opportunity to dig out a study of freshman grades, and showed the the students how to make a predictive model using SAT and high school GPA. The data was from several hundred students, with ACT mapped to SAT scores according to standard formulas. High school grades alone explained 33% of the variance in first year college grades in this sample. Adding SAT bumped it up to 37%. This isn't much added information, given all the trouble and expense of the SAT. Maybe it's just our type of students, but for us, it's not worth the effort. Better would be an attitude and behavior survey like the CIRP.
Tuesday, November 25, 2008
AAC&U's LEAP Initiative and Thinking Skills
If you haven't seen it yet, it's worth looking at the AAC&U's long-awaited LEAP recommendations for the liberal arts. (The link is a pdf to the executive summary). There's a lot there, but will just comment on the thinking skills part, shown below.
 Later on in the summary, they cite some statistics about what employers wish for in graduates:
 Notice anything about the two lists? The thinking skills are permuted somewhat, but they're still there. I'm interested particularly in creative and analytical thinking. In the guidelines these are combined. In the survey data, they are separated. They really should be separated in the guidelines too, because they're vastly different modes of thought. Both of the lists could use some editing. Ideally, the first two of the AAC&U's recommended list would be:
Consider. First we seek to teach students the language of our discipline, and facts about the objects they encounter. We teach them theories about these, and show them how to apply theories. This is the analytical stage of learning. Some students may do very well with this. If they have a good memory and are good at following rules, they'll be good analytical thinkers.
Then, in many disciplines there's a shift. It's subtle, but devastating to some students, particularly if they haven't been warned, or if the instructors aren't aware. We begin to expect students to apply theories to new situations, or to create their own objects and theories. We're surprised when what we see initially looks random. Student try to mimic our process, but process takes them only so far--there's something else required: the magic of the human brain in generalizing, applying inductive reasoning, and the flash of insight or just sheer audacity of thought that distinguishes the best thinkers.
Some students have this naturally--this ability to insert randomness in a controlled way to create useful novelty. Others will flail around producing garbage. It's essential that they have some mastery of the analytical rules and knowledge of the discipline, or they can't edit themselves. They don't know right from wrong, good from bad if they don't have the analytical skills.
We as instructors can prepare students for this, if we are ourselves aware of this divide. For me, it came in a class called Introduction to Analysis, where I was expected to come up with math proofs on my own for the first time. My instructor was intuitive enough to know this was a hard class, and helped us enjoy the process, difficult as it was for most. But she didn't really understand, I think, why it was difficult. It was the transition from analytical to creative thought. I know this now, and preach it to my students. I even mark problems in the homework as creative or analytical. It's an extremely useful idea for organizing courses and curricula, in my experience. We assess it too, in a gentle way that doesn't require lots of tedious bureaucracy.
So there you have it. Critical thinking, in my opinion, is some confusion of analytical and creative processes, and is not a useful dimension for a general classification of cognition. It might be a great thing to focus on in an art or performance class, as a specific skill to be developed, but not as a first tier red-letter (i.e. rubric) goal.
 Later on in the summary, they cite some statistics about what employers wish for in graduates:
 Notice anything about the two lists? The thinking skills are permuted somewhat, but they're still there. I'm interested particularly in creative and analytical thinking. In the guidelines these are combined. In the survey data, they are separated. They really should be separated in the guidelines too, because they're vastly different modes of thought. Both of the lists could use some editing. Ideally, the first two of the AAC&U's recommended list would be:
- Analytical thinking
- Creative thinking
Analytical Thinking includes knowing facts and how they relate to each other. It includes definitions and languages and rules about how they work. For example, one can imagine a field of knowledge as a semantic field over which manipulations are performed explicitly. To the extent this is true, it is an exercise in analytical thinking. Analytical thinking is algorithmic: information retrieval and manipulation. It derives from deductive reasoning: consequences follow from given rules. In math, finding the derivative of a function is an exercise in analytical thinking. Identifying a piece of music as classical is analytical. Deriving the name of an organic molecule is analytical. Determining what a computer program does is analytical. Note that the rules can become very complex, and so there's no limit to the difficulty of analytical reasoning.In summary, analytical thinking is knowing facts and applying rules. Creative thinking is creating new facts and new rules. Without a background in some body of analytical thought, it's not possible to be productively creative. This models wonderfully well the way we teach and construct curricula.
Creative Thinking is inductive or random. It looks for patterns and formulates them. It compresses complexities into simplicities, or does the opposite. It does this in the context of a body of analytical knowledge. Solving a known problem using known methods is not creative--it's analytical. Finding a new way to solve the same problem is creative.
Consider. First we seek to teach students the language of our discipline, and facts about the objects they encounter. We teach them theories about these, and show them how to apply theories. This is the analytical stage of learning. Some students may do very well with this. If they have a good memory and are good at following rules, they'll be good analytical thinkers.
Then, in many disciplines there's a shift. It's subtle, but devastating to some students, particularly if they haven't been warned, or if the instructors aren't aware. We begin to expect students to apply theories to new situations, or to create their own objects and theories. We're surprised when what we see initially looks random. Student try to mimic our process, but process takes them only so far--there's something else required: the magic of the human brain in generalizing, applying inductive reasoning, and the flash of insight or just sheer audacity of thought that distinguishes the best thinkers.
Some students have this naturally--this ability to insert randomness in a controlled way to create useful novelty. Others will flail around producing garbage. It's essential that they have some mastery of the analytical rules and knowledge of the discipline, or they can't edit themselves. They don't know right from wrong, good from bad if they don't have the analytical skills.
We as instructors can prepare students for this, if we are ourselves aware of this divide. For me, it came in a class called Introduction to Analysis, where I was expected to come up with math proofs on my own for the first time. My instructor was intuitive enough to know this was a hard class, and helped us enjoy the process, difficult as it was for most. But she didn't really understand, I think, why it was difficult. It was the transition from analytical to creative thought. I know this now, and preach it to my students. I even mark problems in the homework as creative or analytical. It's an extremely useful idea for organizing courses and curricula, in my experience. We assess it too, in a gentle way that doesn't require lots of tedious bureaucracy.
So there you have it. Critical thinking, in my opinion, is some confusion of analytical and creative processes, and is not a useful dimension for a general classification of cognition. It might be a great thing to focus on in an art or performance class, as a specific skill to be developed, but not as a first tier red-letter (i.e. rubric) goal.
Saturday, November 22, 2008
Graduation Rates by Geographical Region
I'm still working on this retention plan, supplying supporting data and statistics. My previous experiments with geo-mapping attrition weren't entirely what I was looking for. I wanted some numbers to assign. So I took a large sample of students who would have had the opportunity to graduate by now, and ran their home cities through the yahoo pipes to geotag them. Then I grabbed that information as JSON formatted data, dumped it into a text file, and used a perl script to extract lon/lat information and their ID (which I'd included). I rounded the lon/lat down to the nearest integer, and found an atlas that showed the lines.
My perl script calculates graduation rates for each of these regions. Then I tediously marked all this up in Paint (yes, I know... I do have The Gimp installed, but it didn't seem necessary) as percentages. A bit of the result is shown below.
 It's not shown on this snippet, but it's fairly obvious from the map that our two biggest markets could stand some improvements in the persistence department. Useful to know, and it's more quantitative that the other maps.
The Value of Retrospection
When we first started getting serious about finding the causes of retention a few years ago, we decided to implement an "assessment day" survey to gather information about behaviors and attitudes of our students. This has taken place during the last four Octobers in a specially-added class date (one extra was added to the academic calendar). Departments are encouraged to use this time to assess their programs, but IR claims the most popular time slot to administer this shot-gun survey. We get almost half the student body at 9:30 T or Th, and it's a suitable mix of classes, so that works pretty well. The instrument itself is a 100-question scantron survey of questions that were solicited from various academic and administrative units. The form has been reviewed by the IRB, and asks students for their student ID number, which most give voluntarily.
The original idea was to have some retrospective data to look at for retention purposes. It works like this. In fall 2008 we had, of course, a group of students who had attended in fall 2007 but didn't graduate and didn't return: our attrition pool. Because the survey forms are tagged by student IDs, we can look back and see what indicators there might have been. This has proven to be very useful. We have since started using the CIRP for the same purpose--and it's really been a great source of information. It's essential to get as many student IDs as possible, however. Otherwise it's much less useful because you don't know who left and who stayed without the ID.
Here's one method of mining the data. Create your database of student IDs--I'll use just 1st year students from fall 2007 here--and use the trick I outlined here to get a 0/1 computed variable called 'retain' to denote attrit/retain. Add that as a column to the CIRP data or your custom survey by connecting student IDs. You can add other information too, like athlete/non-athlete, or zip code or whatever. Load this data set into SPSS and do an ANOVA, as shown below:
 I've had issues loading directly from Excel, and usually end up saving a table as a .csv file--it seems to import better that way. You can only add 100 variables at a time, and the CIRP is longer than that, so it has to be done in chunks. Each will look something like this:
 When the results roll in, look for small numbers in the significance column. I usually use .o2 as a benchmark. Anything less than that is potentially interesting. Of course, this depends on other factors, like sample size and such.
 Now that's interesting--the ACCPT1st and CHOICE variables are very significant, meaning that they have power in distinguishing between those who returned and those students who didn't. Since I already had this data set in Access, I did a simple query and used the pivot table view to look at the CHOICE variable. For reference, the text of the survey item is:
 Students for whom the institution was their first choice were the first to leave. Not only that, but these are the majority. This turned out to be a critical piece of information. By performing another ANOVA with CHOICE as the key variable, and then using the 'Compare Means -> Means' SPSS report, we can identify particular traits of these 'First Choicers' as we have come to call them. We corraborate this with other information taken from the Assessment Day surveys, and a picture of these students emerges. I also geo-tagged their zip codes to see where they came from. More on First-Choicer characteristics will come in another post.
This was the beginning of the Plan 9 attrition effort, which is deep in the planning phase now. The bottom line is that we discovered that many of our students don't understand the product they're buying, and we don't understand them very well either. It's not the kind of thing one can slap a bandaid fix on, but will require a complete re-think of many institutional practices.
The original idea was to have some retrospective data to look at for retention purposes. It works like this. In fall 2008 we had, of course, a group of students who had attended in fall 2007 but didn't graduate and didn't return: our attrition pool. Because the survey forms are tagged by student IDs, we can look back and see what indicators there might have been. This has proven to be very useful. We have since started using the CIRP for the same purpose--and it's really been a great source of information. It's essential to get as many student IDs as possible, however. Otherwise it's much less useful because you don't know who left and who stayed without the ID.
Here's one method of mining the data. Create your database of student IDs--I'll use just 1st year students from fall 2007 here--and use the trick I outlined here to get a 0/1 computed variable called 'retain' to denote attrit/retain. Add that as a column to the CIRP data or your custom survey by connecting student IDs. You can add other information too, like athlete/non-athlete, or zip code or whatever. Load this data set into SPSS and do an ANOVA, as shown below:
 I've had issues loading directly from Excel, and usually end up saving a table as a .csv file--it seems to import better that way. You can only add 100 variables at a time, and the CIRP is longer than that, so it has to be done in chunks. Each will look something like this:
 When the results roll in, look for small numbers in the significance column. I usually use .o2 as a benchmark. Anything less than that is potentially interesting. Of course, this depends on other factors, like sample size and such.
 Now that's interesting--the ACCPT1st and CHOICE variables are very significant, meaning that they have power in distinguishing between those who returned and those students who didn't. Since I already had this data set in Access, I did a simple query and used the pivot table view to look at the CHOICE variable. For reference, the text of the survey item is:
Is this college your:Here are the results.
1=Less than third choice?
2=Third choice?
3=Second choice?
4=First choice?
 Students for whom the institution was their first choice were the first to leave. Not only that, but these are the majority. This turned out to be a critical piece of information. By performing another ANOVA with CHOICE as the key variable, and then using the 'Compare Means -> Means' SPSS report, we can identify particular traits of these 'First Choicers' as we have come to call them. We corraborate this with other information taken from the Assessment Day surveys, and a picture of these students emerges. I also geo-tagged their zip codes to see where they came from. More on First-Choicer characteristics will come in another post.
This was the beginning of the Plan 9 attrition effort, which is deep in the planning phase now. The bottom line is that we discovered that many of our students don't understand the product they're buying, and we don't understand them very well either. It's not the kind of thing one can slap a bandaid fix on, but will require a complete re-think of many institutional practices.
Friday, November 21, 2008
Targetting Aid
At the 2008 Assessment Institute I spent my time in sessions on first year seminars and retention strategies. I learned some interesting stuff. One was that at one institution where assignments were tracked, it wasn't the quality of student work that predicted retention, but the amount of it. I decided to test that at my institution by looking at our home-grown portfolio system statistics. I compared the average number of paper submissions by students who were retained to those who left for a single semester. There was no significant difference in our case.
Most strategies I saw targeted student engagement in one way or another. Activities like learning communities or work study increased the likelihood of student success. I asked questions about how retention committees worked with financial aid offices to fine tune awards. This was based on my own work here showing that grades and money are the two big predictors of attrition. No one I talked to had done such a thing, citing institutional barriers to efforts. Well, we've done it here, and had some limited success. Here's what we did.
The graph below shows the student population divided into total aid categories in increments of $3000. This is plotted against retention (dark line) for that group and (on the right scale) GPA for that group (magenta).
 It's obvious that both grades and retention increase with financial aid, which says some interesting things about they way we recruit students, grant institutional aid, and provide academic support services. Ultimately this has led to a comprehensive retention plan I called Plan 9. But what we did immediately was focus on the group of students that have a decent GPA, but are historically showing low retention. That's the group circled on the graph. We targeted these students with small extra aid awards, and saw retention for that group sore to over 80%. I did a follow-up survey of the students receiving this aid to ask if it made a difference. My response rate was low, and the results lead me to believe there were other factors at work too. Maybe we just got lucky. But the results were so good we're trying it again this year.
Plan 9 includes lots of engagement stuff, and is really a comprehensive look at retention from marketing all the way through a graduate's career. A big part of it will focus on re-engineering aid policies. It always amazes me how budget discussions in the spring focus so much attention on tuition policies, when for private colleges at least, aid policies are much more important.
Wednesday, November 19, 2008
Debating the value of SAT scores
A friend sent me a link to a New York Times article about the connection between student SAT scores and graduation rates in the SUNY system. Peter Salins, the author, poses the following question:
One question that the article doesn't answer is who exactly is graduating? Are the higher SAT scorers the ones who are responsible for the graduation rate increases? One would assume so, but it doesn't take much experience in institutional research to learn that you shouldn't assume such things. I ran our numbers to see what the situation is here. The graph below shows entering classes from 2000 to 2003 by quantized SAT, showing graduation rates. The students who didn't take the SAT (about half) graduated at the same rate as those who did, by the way.

We're a small school, so the two-standard deviation error bars are pretty intimidating, but I think we can see there's no support for the idea that the higher the SAT, the higher the graduation rate for our institution. On the other hand, actual grades earned are a good indicator. That doesn't help much for predictive purposes, but it shows that classroom accomplishments matter.
 So for us, SAT is useful as a predictor in conjunction with high school GPA for predicting first year grade averages, but not much more than that. In fact, for our student population (half are first-generation college students) there's a good chance that the SAT underestimates their potential to graduate, leading them to be 'underpriced' in the admissions market compared to schools that put more emphasis on SAT.
Ultimately, it's more important that a student and the institution be a good match than that the student has a high standardized test score. SAT is a very blunt instrument. I think few would dispute that there are correlations with grades and graduation rates that can be useful predictors, but the real question is: is it worth the cost? Are there better ways to match applicants to institutions where they may have a better chance of finding what they want. I'm convinced that in our case there is. Our recent experience with the CIRP survey has convinced me that there are important variables we're not considering when we just look at grades and test scores. Behavior, attitudes, family support, and "cultural capital" are very important. My attitude toward SAT can be summed up in a newly-minted dictionary entry: meh.
[D]o SATs predict graduation rates more accurately than high school grade-point averages? If we look merely at studies that statistically correlate SAT scores and high school grades with graduation rates, we find that, indeed, the two standards are roughly equivalent, meaning that the better that applicants do on either of these indicators the more likely they are to graduate from college. However, since students with high SAT scores tend to have better high school grade-point averages, this data doesn’t tell us which of the indicators — independent of the other — is a better predictor of college success.He explains that the admissions standards of the SUNY system in the 1990s created a natural test as some institutions raised SAT requirements while others didn't, and high school GPA requirements remained roughly the same. The former schools saw significant increases in graduation rates. He concludes that those who wish to do away with SAT requirements are ignoring important information.
One question that the article doesn't answer is who exactly is graduating? Are the higher SAT scorers the ones who are responsible for the graduation rate increases? One would assume so, but it doesn't take much experience in institutional research to learn that you shouldn't assume such things. I ran our numbers to see what the situation is here. The graph below shows entering classes from 2000 to 2003 by quantized SAT, showing graduation rates. The students who didn't take the SAT (about half) graduated at the same rate as those who did, by the way.

We're a small school, so the two-standard deviation error bars are pretty intimidating, but I think we can see there's no support for the idea that the higher the SAT, the higher the graduation rate for our institution. On the other hand, actual grades earned are a good indicator. That doesn't help much for predictive purposes, but it shows that classroom accomplishments matter.
 So for us, SAT is useful as a predictor in conjunction with high school GPA for predicting first year grade averages, but not much more than that. In fact, for our student population (half are first-generation college students) there's a good chance that the SAT underestimates their potential to graduate, leading them to be 'underpriced' in the admissions market compared to schools that put more emphasis on SAT.
Ultimately, it's more important that a student and the institution be a good match than that the student has a high standardized test score. SAT is a very blunt instrument. I think few would dispute that there are correlations with grades and graduation rates that can be useful predictors, but the real question is: is it worth the cost? Are there better ways to match applicants to institutions where they may have a better chance of finding what they want. I'm convinced that in our case there is. Our recent experience with the CIRP survey has convinced me that there are important variables we're not considering when we just look at grades and test scores. Behavior, attitudes, family support, and "cultural capital" are very important. My attitude toward SAT can be summed up in a newly-minted dictionary entry: meh.
Sunday, November 16, 2008
Dynamic Geo-Tagged Maps

Here's a cool thing you can do for free. On the left is a map of our enrolled students, tagged with credit hours. I made a similar one showing students who didn't return. The comparison shows a fairly obvious geographic concentration of attrition. More on that later. This post is about how to create one of these maps.
I found a cool demo on reddit on sending data through yahoo.pipes to google maps. It all sounded very complicated, but I thought of an interesting application one afternoon between committee meetings and tried it out. About six hours later at home I had it debugged and working. Part of the problem was the demo didn't work for me, and I had to rewrite bits. Here's how to do it.
First, you'll need an account with Yahoo. Then sign in on their überkuhl pipes constructor site pipes.yahoo.com. This utility will let you take data from one source and "pipe" it to another, with all kinds of options for filtering along the way. In this case what we want to to is take some data of interest and geo-tag it.
First create a cgi application (or get a friendly web programmer to do so) that takes some data of interest and produces a delimited text file. Here's a sample of mine:
The format is (city, state|detail information). You could include street addresses if you want. For the detail information I used number of students and average credit hours, but you could use GPA or anything you like. I used the pipe character "|" as the delimiter because the addresses have commas in them. The first row doesn't really need to be there--it just names the columns. If you don't know how to write CGI applications based on live data, you can create a static text file and slap it on the web somewhere, and that will work too. So you could take data from a spreadsheet and save it as a delimited text file, put in on your web space and proceed to the next step.Title|description
Aiken,SC|2 ( 71 credits avg)
Alpharetta,GA|2 ( 45 credits avg)
Altoona,PA|2 (149 credits avg)
Amelia court house,VA|1 ( 40 credits avg)
Anniston,AL|3 (156 credits avg)
Second create your pipe to look like the one below. You'll need to sort through the voluminous menu of widgets to find the ones you want, but this is what it should look like.


Third run your pipe. You should get a kind of ugly looking map like the one below.


We can improve this by sending the data to google maps. Find the options menu top right of the map, and use it to select the map format KML (pictured on the left) Don't click on it, but rather right-click to copy the URL this points to.
This URL is now a long string that will request KML information from yahoo pipes, which will then grab it from your file/cgi, geo-tag it, and add the XML markup necessary for google maps to understand it. Very cool.
Finally open up maps.google.com and paste the URL you just saved into the "Search Maps" box. If everything works, you should get something that resembles the map at the top of this post. On the top right of the map is a "Link" hyperlink which you can right-click on and capture a hyperlink to this map. This you can put in a web page or email to someone, so they can pull the map up too.
Over the weekend I created a little application that starts with a web form to collect contact information (name, address, email, etc), stores it in a database, and then redirects the user to a map with all the existing directory information displayed. I'm using it as a directory for family and friends. It's much better than just a list of names and contact information because of the visual nature of actually seeing where everyone lives. When I have time I'll create a generic version anyone can use. In the meantime, if anyone wants the perl code for it, leave a comment here.
Tuesday, November 11, 2008
A Nifty Trick for Mining Either/Or Data
It's often the case that I am interested in generating some data about an either/or condition like student retention. Either the student re-enrolled or did not. You might want to use a pivot table to compare retention rates for male/female, athlete/non-athlete, or by GPA or financial aid award amount. I find myself commonly with two tables of student IDs: those who were here last year, and those who are here now. I should be able to compare those to see who didn't come back, right? We can do that with an appropriate join, and a little magic.
Notice that the join properties are set so that all students from Fall 2007 are included. Data for FAll 2008 will show up as blank for those students.
Now here's the magic: create a field in the query like
Retain: sgn(nz([ID_Nbr],0))
Here, the student ID [ID_Nbr] is from the Fall 2008 set--it may be a null. But the nz() function is set to convert null values to zero. Then it gets passed to the sgn() function, which returns a numerical sign (-1,0,1) of the number. In effect, this takes students who were retained and assigns a one, and students who attrited and assigns a zero. This is exactly what we want. I have included a few other fields of interest in the query, like student gender.
Now run the query as a pivot table. Include our new Retain field in the data section, and set its aggregation property to average. This will average in a one for each retained student in the category, and a zero for the others--exactly the same as a percentage of retained students!
 So with a single query, viewed as a pivot table, we're able to compute percentages of retained students based on whatever variables we have at hand.
You can create either/or variables quite easily. For example, suppose you want to know the percentage of students with GPA >2.5 who took ENG 101. Create a field based on overall GPA, and use something like:
GPAQuality: int([overallGPA]/2.5)
This will round down anything less than 2.5 to a zero, and anything bigger (well, up to 5) to a 1. Setting this field to average in the data part of a pivot table will compute the percentages for you.
Monday, October 27, 2008
IUPUI Presentation: Why it's hard to use assessment results...
Thanks to all who attended the session! This post is to summarize a couple of main points, give you a link to the powerpoint slides, and give you an opportunitity to continue the discussion by leaving comments.
First, the slides are here. You can also find information about other efforts, like our general education assessment program here.
Main points to consider in designing, analyzing, and reporting, from the talk:
First, the slides are here. You can also find information about other efforts, like our general education assessment program here.
Main points to consider in designing, analyzing, and reporting, from the talk:
- Do your own design for anything complex. Only you know what you really want, and remember that you'll have to understand and explain the results. Sorry, CLA!
- You can assess even what you're not teaching. Faculty love it, if it's done right. For more information, you can read a whole report about our gen ed assessment.

- For learning outcomes, try to find a scale that matches what you want to report longitudinally. For example, remedial work through graduate level. We use four levels, which has worked really well.
- We don't really measure learning. We estimate parameters associated with it, in a statistical sense. This makes aggragation difficult to justify in most cases (a thousand blabbering fools cannot be summed to equal the product of a fine orator). So avoid averages like the plague--they compress the data too much to be useful. Use proportions and frequencies, or mininum and maxiumum ratings, for example. Of course, when you want pretty graphs that go up, feel free to foist off averages on some constituents who need that kind of thing.
- [not mentioned] You don't have to report assessment data to deans and presidents. This can make faculty and chairs suspicious about how the information is used, and more likely that it will be 'improved' artificially. Instead, you can have them report improvements they've made, and ask them to demostrate how the data clued them in. This is what you want anyway--continual improvement, not proof of absolute achievement.
- Learn how to use Excel pivot tables! Really--you'll be glad you did. Logistical regression is useful for predicting either/or conditions like retention. ANOVA is good for sifting through a lot of data for resonant bits.
- Attitude and behavior surveys are great for linking to achievement data. NSSE, CIRP, and the rest are very useful, but you need student IDs to link with.
I'd love to know if any of this helps you out!
Thursday, April 24, 2008
Why I don't understand the assessment results...
...and what I can do about it.
This post is for comments related to my session on Friday, April 25 in Cary, NC, at the NCSU Undergraduate Assessment Symposium. The description is:
UPDATE: thanks to Dr. Pamela Steinke for noting some great questions during the talk. Here are my answers.
This post is for comments related to my session on Friday, April 25 in Cary, NC, at the NCSU Undergraduate Assessment Symposium. The description is:
In pursuit of generating general education assessment results, we may enthusiastically adopt methods that are convenient but artificial. We explore ways to ‘find’ authentic assessments and present summary reports that your grandma can understand. The benefits are a better integration of assessment with the curriculum, and a much easier time convincing faculty that you know what you’re doing. With examples, colorful charts, and a manageable dose of epistemology.The PowerPoint slides will be posted on the college's assessment site. There you can also find information about Coker College's general education assessment program, the open source software we developed to manage accreditation documents, our compliance report, and other stuff.
UPDATE: thanks to Dr. Pamela Steinke for noting some great questions during the talk. Here are my answers.
Q: To what degree does your institutional mission statement reflect your general education goals?
A: From the discussion, it seems as though Coker is a bit unusual in having liberal arts goals explicitly stated in the mission. The middle paragraph of our mission lists analytical and creative thinking, effective speaking and writing as educational goals. This makes it easier to rally the faculty around these.
Q: How often do the results of assessment data and assessment results get shared and acted upon at your institution?
A: For our general education assessment, we have a faculty meeting at the beginning of the year where a report is given on the big picture. Then departments get reports at the program and individual student level. Additionally, committees like the institutional effectiveness committee will use assessment data sporadically throughout the year.
Q: When trying to assess complex processes, the greater the reliability of your measure the less the validity. Do you have examples of this?
A: Remember that validity is in the eye of the beholder to a large extent. As reasoning creatures, we model phenomenon with simple relationships (like linear ones, for example), and the word "complex" in common useage can mean “hard to predict”. Complexity has a technical definition that is quite useful (see Kolmogorov Complexity on the web), but requires a fuller explanation than I can give here. It’s easy to create examples of high complexity skills that can be reliably tested. For example, a single question can test if someone can pilot a 747: “Can you pilot a 747?”. This would very likely be quite reliable in the sense that subsequent repetitions would give the same response. Is it valid? I wouldn’t trust my life to it! On the other hand, impressions from a first date can be assumed to be meaningful (valid), even though the reliability is zero—you can’t have two first dates with the same person, so the whole concept of reliability is meaningless in this instance. In daily life, most things we do fall in the second category.
A point I made in the session is that complex phenomena manifest themselves in more ways than simple ones. Testing for knowledge of simple multiplication, for example, consists of verifying that the subject can solve a few problem types. If we wanted to test for knowledge of the US tax code, on the other hand, how would we have complete confidence in our results? We'd literally have to test every part of the tax code--an impossible task for any individual I imagine. Thus we tend to reduce complex outcomes to some subset. This can cause a merelogical fallacy--substituting the part for the whole, like in the 747 example. This reduces validity if you care about these details.
Q: How important is it that general education assessments be done in context of the discipline? Can general education skills be assessed with validity outside of disciplinary context?
Q: Means should only be calculated across the same unit. Do you have examples of inappropriate use of means?
A: Three pounds of grapes plus four pounds of nuts is seven pounds, but not of grapenuts. Aggregation works great with quantities, but not so well with qualities. (Averaging is just aggregation with a division afterwards.) So averaging math assessments with writing assessments is probably questionable. But this is exactly how GPAs are computed, of course! The average is pretty meaningless as a number. What a high GPA tells you, for example, is that a student did well in most of his or her classes. A proportion would do a better job. If you set B grades as your threshold, you could look at the percentage of course grades that meet that threshold and get, say Johnny has 34% and Mary 95%, which would more directly tell you what you’re interested in. A student who has a GPA of 2.0 could have had a 4.0 for a year, and then had a really rotten year because of some personal problem. Or it could be a solid C student. Are these the same thing? No. I realize that this sound heretical, since grade point averages are the currency of the registrar's office, but it's the kind of figure you should take with a grain of salt. It tells you something, but maybe not the most important thing you care about. As in any kind of data compression, you run the risk of losing something important. There's a joke about engineers who want to account for the presence of humans in a building in order to anticipate their impact on the wireless network (water interferes with it). Their first assumption is "assume a human is a one meter diameter sphere of water." This data compression might work well in one context, but not another.
Q: What tools have you found especially helpful with data analysis and reporting. Pivot tables, logistic regression….
A: The combination of database + pivot table is extremely powerful. Logistic regression is a special need kind of thing, but is designed to predict binary events like attrition. A very useful trick with pivot tables is to redefine scalar quantities (decimal numbers or integers) into a 0 or 1. For example, you could classify students with 3.0 GPA or above a 1 and the others as 0. When you use this field in the pivot table as data, tell it to average, and display as a percentage. It will then read off the percentage of the group (e.g. demographic) that falls in that classification. When I get a chance, I’ll put more detailed instructions with screenshots on this blog.
Q: Share ways you get more useful results by analyzing data categorically rather than looking at means.
A: You can more easily see extremes. How many students perform very well or very poorly? This can get averaged out easily, and hence lost on average reports. But it’s individual students we deal with, not average students, so these extremes matter. Another example is to look at assessment data by gender, ethnicity, or classroom performance (grades).
Q: What important details do the averages hide? Do you have any examples in which reporting the minimum and maximum would be more appropriate?
A: Averages hide the composition of the results, obliterating the distribution. Would you rather teach a class with half brilliant students and half remedial, or one with nearly uniform preparation and ability? The average ability (if such a thing were to exist) is the same in both. A prominent figure in the testing industry visited our campus a couple of years ago, and I had the opportunity to review our results from an instrument he’d designed. I brought the sheets with averages on them. He said “I don’t know why we even publish this stuff—where are the distributions?” Unfortunately, it took me another two years to figure out what he meant. Instead of averages, consider defining a cut-off for acceptable/unacceptable. This creates a meaningful reduction in data that can be used simply with pivot tables, for example. Maxes and mins or the whole distribution can be given fairly easily. These are quite informative—usually more so than the average.
Q: How can I present the data in a way that is most useful for faculty for improvement?
A: This may be a question to pose to the faculty, but certainly I would avoid the “lines go up” global graph of data, unless it’s just to provide context. If the report doesn’t connect their conceptual model of what they can change to the assessment results, they’ll simply be puzzled about what to do with it. The best case is if they are the ones generating the data to begin with—then they’ll have a better idea than anyone of what it means in functional terms. You can read how we try to accomplish that on our assessment website. We call it Assessing the Elephant.
Saturday, February 02, 2008
Financial Aid is like Popcorn
Ever wonder why popcorn at the movies is $7 for a medium-sized bucket? The answer is related to why we use financial aid to generate revenue. Because you’re probably more familiar with college finances than movie theater finances, we’ll use numbers that make sense in that sphere.
Imagine that we have an admissions office that works to bring in applicants. Of those who are accepted, some will choose to attend and some won’t. In order to simplify this to make a workable model, I’ll assume that all other variables are equal and focus solely on price. I will also assume that price is a predictor of enrollment, in that the lower the price becomes, the more likely an applicant is to attend. It may be the case in some markets that being more expensive makes one more attractive, but I won’t consider that case here.
In our hypothetical college, I’ll consider 500 applicants, some of whom will pay up to 20,000 per year to attend. We’re not providing them with financial aid—they have to pay the full sticker price. You could obviously substitute whatever other numbers you like.
The graph below has two lines on it. The blue one going up from left to right is the revenue per student for each tuition level. Since there is no discounting, revenue / student = tuition.

The descending pink line is the probability that an individual student will choose to attend at the given price. It has a separate vertical axis, shown on the right. In reality, this line might not be perfectly straight, but it will serve as an approximation for purposes of this discussion.
If we multiply the probability of attendance by the revenue per student, we get the average revenue per applicant that we should realize using a given tuition. This graph is shown in black below.
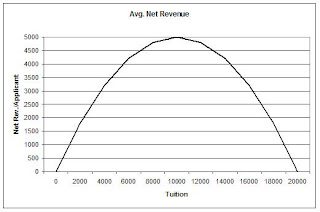
The maximum value for net revenue per applicant is when Pr[enrollment] = .5, which happens at the point where tuition = 10,000. So we could make maximum revenue by setting our tuition to this point. To find total revenue, just multiply by the 500 applicants to get $2.5M. If we set the tuition higher, the extra money per student is lost (and then some) because of declining enrollment. Similarly, if tuition is lower, we don’t make up the difference in extra students.
Suppose, however, that we have some information about these applicants. We know, for example, something about their financial status, and therefore how sensitive they may be to price. We’ll divide our applicants into two groups: the first group is the one we’ve already considered, and a second group that is more sensitive to prices. These are show below.

As you can tell from the graph, the blue line shows a zero probability for the price-sensitive applicants to enroll if the tuition is higher than 10,000. If half of our applicants fall into this category, we should consider two separate graphs of net revenue per applicant, and average them to find the function to be used to maximize revenue. Here it is.
 Now our total revenue is maximized when tuition = $7000. If we set it higher, we lose too many of the price-sensitive applicants, even though the other group is willing to pay. The solution to this dilemma is to shift the pink curve to the right by discounting the price for those applicants. If we can set two prices, one for those who price-sensitive, and a higher one for those who are more willing or able to pay, we can optimize the shape of this average curve. For example, by granting the price-sensitive applicants a $5000 discount on tuition, we obtain the combined curve shown below.

The optimal point is now to set tuition at 10,000, for a net revenue per applicant of 3,750, an increase of 12.7% over the non-discounted optimum.
So what does this have to do with movie popcorn? Consider these two models: charge $13 for a movie ticket and $7 for popcorn, OR charge $20 for a ticket and give the popcorn away free. The first strategy will make more money if enough people buy popcorn. For some strange reason, they form long lines to get it. Just remember when you’re in the queue for the GIANT COMBO that you’re providing financial aid for some movie-goer who has the dough to get in the door, but can’t afford the premium snacks.
Imagine that we have an admissions office that works to bring in applicants. Of those who are accepted, some will choose to attend and some won’t. In order to simplify this to make a workable model, I’ll assume that all other variables are equal and focus solely on price. I will also assume that price is a predictor of enrollment, in that the lower the price becomes, the more likely an applicant is to attend. It may be the case in some markets that being more expensive makes one more attractive, but I won’t consider that case here.
In our hypothetical college, I’ll consider 500 applicants, some of whom will pay up to 20,000 per year to attend. We’re not providing them with financial aid—they have to pay the full sticker price. You could obviously substitute whatever other numbers you like.
The graph below has two lines on it. The blue one going up from left to right is the revenue per student for each tuition level. Since there is no discounting, revenue / student = tuition.

The descending pink line is the probability that an individual student will choose to attend at the given price. It has a separate vertical axis, shown on the right. In reality, this line might not be perfectly straight, but it will serve as an approximation for purposes of this discussion.
If we multiply the probability of attendance by the revenue per student, we get the average revenue per applicant that we should realize using a given tuition. This graph is shown in black below.

The maximum value for net revenue per applicant is when Pr[enrollment] = .5, which happens at the point where tuition = 10,000. So we could make maximum revenue by setting our tuition to this point. To find total revenue, just multiply by the 500 applicants to get $2.5M. If we set the tuition higher, the extra money per student is lost (and then some) because of declining enrollment. Similarly, if tuition is lower, we don’t make up the difference in extra students.
Suppose, however, that we have some information about these applicants. We know, for example, something about their financial status, and therefore how sensitive they may be to price. We’ll divide our applicants into two groups: the first group is the one we’ve already considered, and a second group that is more sensitive to prices. These are show below.

As you can tell from the graph, the blue line shows a zero probability for the price-sensitive applicants to enroll if the tuition is higher than 10,000. If half of our applicants fall into this category, we should consider two separate graphs of net revenue per applicant, and average them to find the function to be used to maximize revenue. Here it is.
 Now our total revenue is maximized when tuition = $7000. If we set it higher, we lose too many of the price-sensitive applicants, even though the other group is willing to pay. The solution to this dilemma is to shift the pink curve to the right by discounting the price for those applicants. If we can set two prices, one for those who price-sensitive, and a higher one for those who are more willing or able to pay, we can optimize the shape of this average curve. For example, by granting the price-sensitive applicants a $5000 discount on tuition, we obtain the combined curve shown below.
The optimal point is now to set tuition at 10,000, for a net revenue per applicant of 3,750, an increase of 12.7% over the non-discounted optimum.
So what does this have to do with movie popcorn? Consider these two models: charge $13 for a movie ticket and $7 for popcorn, OR charge $20 for a ticket and give the popcorn away free. The first strategy will make more money if enough people buy popcorn. For some strange reason, they form long lines to get it. Just remember when you’re in the queue for the GIANT COMBO that you’re providing financial aid for some movie-goer who has the dough to get in the door, but can’t afford the premium snacks.
Subscribe to:
Posts (Atom)