Ever wonder why popcorn at the movies is $7 for a medium-sized bucket? The answer is related to why we use financial aid to generate revenue. Because you’re probably more familiar with college finances than movie theater finances, we’ll use numbers that make sense in that sphere.
Imagine that we have an admissions office that works to bring in applicants. Of those who are accepted, some will choose to attend and some won’t. In order to simplify this to make a workable model, I’ll assume that all other variables are equal and focus solely on price. I will also assume that price is a predictor of enrollment, in that the lower the price becomes, the more likely an applicant is to attend. It may be the case in some markets that being more expensive makes one more attractive, but I won’t consider that case here.
In our hypothetical college, I’ll consider 500 applicants, some of whom will pay up to 20,000 per year to attend. We’re not providing them with financial aid—they have to pay the full sticker price. You could obviously substitute whatever other numbers you like.
The graph below has two lines on it. The blue one going up from left to right is the revenue per student for each tuition level. Since there is no discounting, revenue / student = tuition.

The descending pink line is the probability that an individual student will choose to attend at the given price. It has a separate vertical axis, shown on the right. In reality, this line might not be perfectly straight, but it will serve as an approximation for purposes of this discussion.
If we multiply the probability of attendance by the revenue per student, we get the average revenue per applicant that we should realize using a given tuition. This graph is shown in black below.
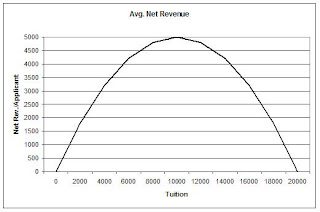
The maximum value for net revenue per applicant is when Pr[enrollment] = .5, which happens at the point where tuition = 10,000. So we could make maximum revenue by setting our tuition to this point. To find total revenue, just multiply by the 500 applicants to get $2.5M. If we set the tuition higher, the extra money per student is lost (and then some) because of declining enrollment. Similarly, if tuition is lower, we don’t make up the difference in extra students.
Suppose, however, that we have some information about these applicants. We know, for example, something about their financial status, and therefore how sensitive they may be to price. We’ll divide our applicants into two groups: the first group is the one we’ve already considered, and a second group that is more sensitive to prices. These are show below.

As you can tell from the graph, the blue line shows a zero probability for the price-sensitive applicants to enroll if the tuition is higher than 10,000. If half of our applicants fall into this category, we should consider two separate graphs of net revenue per applicant, and average them to find the function to be used to maximize revenue. Here it is.

Now our total revenue is maximized when tuition = $7000. If we set it higher, we lose too many of the price-sensitive applicants, even though the other group is willing to pay. The solution to this dilemma is to shift the pink curve to the right by discounting the price for those applicants. If we can set two prices, one for those who price-sensitive, and a higher one for those who are more willing or able to pay, we can optimize the shape of this average curve. For example, by granting the price-sensitive applicants a $5000 discount on tuition, we obtain the combined curve shown below.

The optimal point is now to set tuition at 10,000, for a net revenue per applicant of 3,750, an increase of 12.7% over the non-discounted optimum.
So what does this have to do with movie popcorn? Consider these two models: charge $13 for a movie ticket and $7 for popcorn, OR charge $20 for a ticket and give the popcorn away free. The first strategy will make more money if enough people buy popcorn. For some strange reason, they form long lines to get it. Just remember when you’re in the queue for the GIANT COMBO that you’re providing financial aid for some movie-goer who has the dough to get in the door, but can’t afford the premium snacks.
 It's obvious that both grades and retention increase with financial aid, which says some interesting things about they way we recruit students, grant institutional aid, and provide academic support services. Ultimately this has led to a comprehensive retention plan I called Plan 9. But what we did immediately was focus on the group of students that have a decent GPA, but are historically showing low retention. That's the group circled on the graph. We targeted these students with small extra aid awards, and saw retention for that group sore to over 80%. I did a follow-up survey of the students receiving this aid to ask if it made a difference. My response rate was low, and the results lead me to believe there were other factors at work too. Maybe we just got lucky. But the results were so good we're trying it again this year.


