Friday, December 16, 2011

Free Hypothesis-Generating Software

In the last year there have been announcements of two free software packages that use machine learning techniques to mine data for relationships. The resulting mathematical formulas can be used to form hypotheses about the underlying phenomena (i.e. whatever the data represents).

The first one I have mentioned before. It's Eureqa from Cornell, which uses symbolic regression. There is an example on the Eureqa site that poses this sample problem:
This page describes an illustrative run of genetic programming in which the goal is to automatically create a computer program whose output is equal to the values of the quadratic polynomial x2+x+1 in the range from –1 to +1. That is, the goal is to automatically create a computer program that matches certain numerical data. This process is sometimes called system identification or symbolic regression.
The program proceeds as an evolutionary search. The graph pictured below is a schematic of the way the topology of the evolved "critters" is formed.
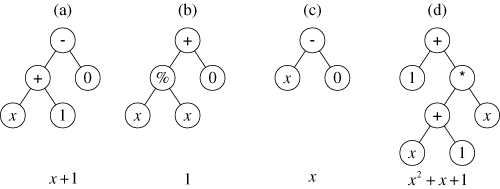
A family tree of mathematical functions. (Image Source: geneticprogramming.com)
There is a limitation to genetic programming that is also a threat to any intelligent endeavor: the problem may not be amenable to evolutionary strategies. There are some problems where the only way to solve them is exhaustive search. Only if the solution space is "smooth" in the sense that good solutions are "near" almost-good solutions is the genetic approach going to find solutions faster than exhaustive search. On a philosophical note, modern successes with physical sciences suggest that the universe is kind to us in this regard. The "unreasonable effectiveness" of mathematics (the title of an article by Eugene Wigner) in producing formulas that model real world physics is a hopeful sign that we may be able to decode the external environment so that we can predict it before it kills us. (The internal organization of complex systems is another matter, and there's not much success to look to there.). Note, however, that even here formulas have not really been evolutionary, but revolutionary. The formulation of Newton's laws of motion are derivable from Einstein's relativity, but not vice versa. The "minor tweak" approach doesn't work very often, Einstein's Cosmological Constant notwithstanding.

The second data miner is aptly called MINE, and comes from the Broad Institute of Harvard and MIT. You can read about it on their site broadinstitute.org. The actual program is hosted at exploredata.net, where you can download a java implementation with an R interface. Here's a description from the site:
One way of beginning to explore a many-dimensional dataset is to calculate some measure of dependence for each pair of variables, rank the pairs by their scores, and examine the top-scoring pairs. For this strategy to work, the statistic used to measure dependence should have the following two heuristic properties. 
Generality: with sufficient sample size the statistic should capture a wide range of interesting associations, not limited to specific function types (such as linear, exponential, or periodic), or even to all functional relationships. 
Equitability: the statistic should give similar scores to equally noisy relationships of different types. For instance, a linear relationship with an R2 of 0.80 should receive approximately the same score as a sinusoidal relationship with an R2 of 0.80.
It's interesting that this is a generalized approach to my correlation mapper software, the difference being that I have only considered linear relationships. For survey data, it's probably not useful to look beyond linear relationships, but I look forward to trying the package out to see what pops up. It looks easy to install and run, and I can plug it into my Perl script to automatically produce output that complements my existing methods. A project for Christmas break, which is coming up fast.

Update: I came across an article at RealClimate.org that illustrates the danger of models without explanations. Providing a correlation between items, or a more sophisticated pattern based on Fourier analysis or the like, isn't a substitute for a credible explanatory mechanism. Take a look at the article and comments for more.

By coincidence, I am reading Emanaul Derman's book Models.Behaving.Badly: Why Confusing Illusion with Reality Can Lead to Disaster, on Wall Street and in Life. It has technical parts, which I find quite interesting, and more philosophical parts that leave me scratching my head. The last chapter, which I haven't read yet, advertises "How to cope with the inadequacies of models, via ethics and pragmatism." Stay tuned...

Update 2: You can read technical information about MINE in this article and supplementary material.

Saturday, December 10, 2011

Randomness and Prediction

I saw a question at stackoverflow.com asking why computer programs can't produce true random numbers. I can't locate the exact page now, but here's a similar one. The question spooked around in my head all day, despite my head-down work to catch up on paperwork after being away at the SACSCOC meeting (see the tweets). After coming home, I finally gave in and wrote some notes down on the topic. It has applications to assessment, believe it or not.

According to complexity theory, "random" means infinitely complex. Complexity is the size of a perfect description of, for example, a list of numbers. If we are given an infinitely long list of numbers like
1, 1, 1, 1, 1, ....
it's easy to see that it has very low complexity. We can describe the sequence as "all ones."  Similarly, the powers of two makes a low complexity sequence, or any other simple arithmetic sequence. We could create a more complicated computer program that tries to produce numbers that are as "mixed-up" as possible--this is what pseudo-random number generators do, but if we have access to the program (i.e. the description of the sequence), we could perfectly predict the numbers in the sequence. It's hard to call that random.

Truly random numbers (as far as we know) come from real-world phenomena like radioactive decay. You can have a certain amount of this so-called "entropy" for free from internet sources like Hotbits. I use such services for my artificial life experiments (insert maniacal laugh here). Real randomness is a valuable commodity, and I'm constantly running over my limit for what I can get for free from these sites. Here's a description from their site of where the numbers come from:
HotBits is an Internet resource that brings genuine random numbers, generated by a process fundamentally governed by the inherent uncertainty in the quantum mechanical laws of nature, directly to your computer in a variety of forms. HotBits are generated by timing successive pairs of radioactive decays detected by a Geiger-Müller tube interfaced to a computer.
What would be involved if you wanted to predict a sequence of such numbers (which will come in binary as ones and zeros)? As far as we know, radioactive decay is not predictable from knowing the physical state of the system (see Bell's Theorem for more on such things).

Even in a mechanical system such as a spinning basket of ping-pong balls, like those used for selecting the winning numbers in lotteries, a complete description of the system that is sufficient to allow you to predict which balls will emerge to declare the winner would be a very long set of formulas and data. In other words, even if it's not infinitely complex, it's very, very complex.

But what if we want partial credit? This was the big idea that had half my brain working all day. What if we are content to predict some fraction of the sequence, and not every single output? (Like "lossy" compression of image files versus exact compressors for executables.) For example, if I flip a coin over and over, and I confidently "predict" for each flip that it will come up heads, I will be right about half the time (in fact, any predictor I use is going to be right half the time). So even with the simplest possible predictor, I can get 50% accuracy.

Imagine that we have an infinitely complex binary sequence S-INF that comes from some real source like radioactive decay. We write a program to do the following:
For the first 999,999 bits, we output a 1 each time. For the one-millionth bit we output the first S-INF bit, which is random. Then we repeat this process forever, with very long strings of 1s followed by a random one or zero. Call this sequence S-1
It should be clear that a perfect predictor of S-1 is impossible with a finite program. It's still infinitely complex because of the interjection of bits from S-INF. But on the other hand, we can accurately predict the sequence a large portion of the time. We'll be wrong once in every two million bits, on average, if we just predict that the output will be 1 every time.

There is a big difference between randomness and predictability. If we take this another step, we could imagine making a picture of prediction-difficulty for a given sequence. An example from history may make this clearer.
Before Galileo, many people presumably thought that heavy objects fell faster than lighter objects. This is a simple predictor of a physical system. It works fine with feathers and rocks, but it gives the wrong answer for rocks of different weights. Galileo and then Newton added more description (formulas, units, measurements) that allowed much better predictions. These turned out to be insufficient for very large scale cases, and Einstein added even more description (more math) to create a more complex way of predicting gravitational effects. We know that even relativity is incomplete, however, because it doesn't work on very small scales, so theorists are trying ideas like string theory to find an even more complex predictor that will work in more instances. This process of scientific discovery increases the complexity of the description and increases the accuracy of predictions as it does. 
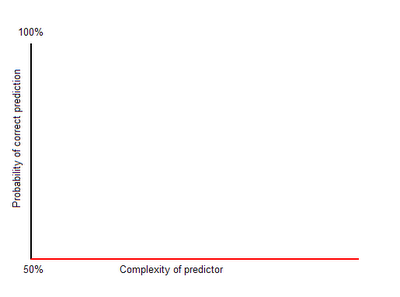
Perfect prediction in the real world can be very, very complex, or even infinitely complex. That means that there isn't enough time or space to do the job perfectly. As someone else has noted (Arthur C. Clark?), some systems are so complex that the only way to "predict" what happens is to watch the system itself. But even very complex systems may be predictable with high probability, as we have seen. What is the relationship between the complexity of our best predictor and the probability of a correct prediction? This will depend on the system we are predicting--there are many possibilities. Below are some graphs to illustrate predictors of a binary sequence. Recall that a constant "predictor" can't do worse that 50%.

The optimistic case is pictured below. This is embodied in the philosophy of progress--as long as we keep working hard, creating more elaborate (and accurate) formulas, the results will come in the form of better and better predictors.

 The worst case is shown below. No matter how hard we try, we can't do better than guessing. This is the case with radioactive decay (as far as anyone knows).
The graph below is more like the actual progress of science as a "punctuated equilibrium." There are increasingly large complexity deserts, where no improvement is seen. Compare the relatively few scientists that led to Newton's revolution or the efforts of Einstein and his collaborators to the massive undertaking that is string theory (and its competition, like loop quantum gravity).
Note that merely increasing the complexity of a predictor is easy. The hard part is figuring out how to increase prediction rates. You can always make a formula or description more complex, but by doing so it doesn't guarantee that the predictors are any better. Generally speaking, there is no computable (that is, systematic or deterministic) method for automatically finding optimal predictors for a given complexity level. You might think that you could just try every single program of a given complexity level and proceed by exhausting the possibilities, but you run into the Halting Problem. There are practical ways to tackle the problem though. This is a topic from the part of computer science called machine learning. A new tool that appeared this year from Cornell University is Eureqa, a program for finding formulas to fit patterns in data sets using an evolutionary approach.

Next time I will apply this idea to testing and outcomes assessment. It's very cool.

Friday, December 09, 2011

X-Raying Survey Data

I continue to develop and use the software I patched together to look at correlates (or covariates) within large scalar or ordinal data sets like surveys. I have gotten requests from several institutions in and out of higher ed to do these. A couple of interesting graphs that resulted are shown below, with permission of the owners of the data, who shall remain anonymous. Both of these are HERI surveys. I have found the HERI surveys the most revealing, partly because they discriminate so well between different dimensions. Some other surveys seem to produce (in the data sets I've seen) big globs of correlated items that are hard to get meaning from.

First the CIRP Freshman Survey at a private college. It neatly divides up the survey respondents into clusters. Rich urban kids negatively correlated to working class or middle class kids, athletes, the religious, and the environmentally-conscious all show up clearly. I've labeled the optional questions with an approximation of the prompt.[Download full-sized graph]
Next is the Your First Year College Survey at a different private college. I find the link between texting in class and recommending the school to others particularly interesting. That's at the bottom. Red lines are negative correlations.[Download full-sized graph]

Higher Ed's 1%

I found this chart at the Chronicle very interesting. It shows the ratio of presidential pay to average professor pay. For example, at Stevenson University, it's 16 to 1.


My rule of thumb is that the quality of an institution is ranked by Instructional Costs/FTE. Here are some selected institutions from the right side of the chart, along with their "Z-scores", courtesy of CollegeResultsOnline (2009 data).


Friday, December 02, 2011

Rubrics as Dialogue

In the last few articles beginning with "The End of Preparation", I have contrasted two epistemologies. One proceeds by definition, which I called monological, and the other emerges from dialogue. These are distinct and equally useful ways of understanding the world. We could display the discipline of physics as a very successful monological system. It allows scientists and engineers to model physical systems and design systems that will work as intended. It allows us to understand what the sun is, and where the atoms in our bodies came from, all as part of a broad model that uses consistent monological language. This successful union of reality, language, and model is what makes the physical sciences so powerful. With such a language we can think precisely about complexity, for example, which is the size of the description of some physical system. A jar of marbles being shaken is complex because each marble's position and velocity are different, requiring a long list of physical attributes to be listed. If they are all at rest in a square shape, the description in physical language can be compressed, and the state is less complex. Physicists would refer to this as high entropy versus low entropy.

By comparison, the language and ways of knowing that create popular culture is dialogical. There are no rules set down about what new words (or memes, if you prefer) will arise, and no deterministic rules that could be applied to predict cultural evolution. A stock exchange has some elements of monologism (precise definitions regarding financial transactions, for example), but the evolution of prices is dialogical--unpredictable consensus between buyers and sellers.

One of the characteristics that distinguishes a monological language from a dialogical one is that in the former case, the names can be arbitrary. What matters is their relationship in the model that's used for understanding the world. For example, electricity comes in Volts and Amperes, and its power is measured in Watts. These are names of scientists, as are the Ohm, Henry, and Farad, terms that refer to electrical properties of circuit elements. If they were dialogical names, they would more likely be "Zap," "Spark," and "Shock" or something similarly descriptive. This is because in a dialogue, it's an asset for words to be descriptive--you don't have to waste extra time saying what it is you meant. By contrast, it's enough to know that V=IR when calculating voltage in a circuit. It doesn't matter whether we call it Volts or Zaps.

It's a trope to poke fun at academics who speak in high-falutin' language just to say something ordinary. When Sheldon in Big Bang Theory gets stuck on a climbing wall, he says "I feel somewhat like an inverse tangent function that's approaching an asymptote," which is then reinforced by his desperate follow-up "What part of 'an inverse tangent function approaching an asymptote' did you not understand?" [video clip]  Some might argue that some academic disciplines that are inherently more dialogical use language that's unnecessarily opaque. This point was publicly made in the "Sokal Affair," where a scientist submitted a jargon-laden meaningless paper to a humanities journal as a hoax, and it was published.

Using Rubrics for Assessment
In order to connect these ideas to the assessment practice of using rubrics, let me first review what they are.

The term "rubric" in learning outcomes assessment means a matrix that indexes competencies versus accomplishment levels. For example, a rubric for rating student essays might include a "correctness" competency, which is probably one of several on the rubric. There would be a scale attached to correctness, which might be Poor, Average, Good, Excellent (PAGE), or one tied to a development sequence like "Beginning" through "Mastering." In our Faculty Assessment of Core Skills survey, we use Developmental, Fresh/Soph, Jr/Sr, Graduate to relate the scale to the expectations of faculty.

A rubric alone is not enough to do much good. A fully-developed process using rubrics might go something like this, starting with developing your own.

  1. Define a learning objective in ordinary academic language. "Students who graduate from Comp 101 should be able to write a standard essay that uses appropriate voice, is addressed to the target audience, is effective in communicating its content, and is free from errors."
  2. The competencies identified in the outcomes statement are clear: voice, audience, content, and correctness. These define the rows of the rubric matrix.
  3. Decide on a scale and language to go with it, e.g. PAGE.
  4. Describe the levels of each competency in language that is helpful to students. It's better to be positive than negative--that is, define what you want, not what you don't want when possible. There are many resources on constructing rubrics you can consult. The AAC&U's VALUE rubrics are examples to refer to.
  5. The rubric should be used in creating assignments, and distributed with the assignment, so the student is clear about expectations. Use of rubrics in grading varies--it's not necessary to tie an assessment to a grade, but there are some obvious advantages if you do.
  6. Rating the assignment that was designed with the rubric in mind should not be a challenge. If it's essential to have reliable results, then multiple raters can be used, and training sessions can reduce some of the variability in rating. Nevertheless, it's not an exact process.
  7. Over time you create a library of samples to show students (and raters) what constitutes each achievement level.
Note that the way to do this is NOT to take some rubric someone else has created and apply it to assignments that were not created with the rubric in mind. That's how I did it the first time, and wasted everyone's time.

Rubrics as Constructed Language
The learning objectives that rubrics are employed to assess are often complex, so even though an attempt is made to define the levels of accomplishment, these descriptions are in ordinary language. That is, there's no formal deductive structure or accompanying model that deterministically generates output ratings from inputs. Instead, the ratings rely on the judgment of professionals, who are free to disagree with one another. If your attitude is that there is one true rating that all raters must eventually agree on, you're likely to be frustrated. One problem is that although the competencies, like content and correctness in the example, are not independent. If there are too many spelling and grammar mistakes on a paper to gain any sort of comprehension, content, style, voice, and so on are also going to be degraded. One rater of writing samples I remember was adamant that a single spelling mistake implied that all other ratings would be lowered as well. 

So using rubrics is dialogical, but by the way of a nice compromise. The power in rubrics comes from restraining the language we use to describe student work, according to a public set of definitions. Even though these are not rigorous, they are still extremely useful in focusing attention on the issues that are deemed important. In addition, rubrics create a common language in the learning domain. It's important for students not to just know content, but how professionals critique content, and rubrics are a way to do that. They can be used for self-reflection or peer review to reinforce the use of that language.

The advantage of generating useful language is one reason I only use a PAGE scale as a last resort. Terms like poor, average, and so on are too generic, and too easily made relative. An excellent freshman paper and an excellent senior paper should not be the same thing, right? Bad choices in these terms early on can have long-term consequences when you want to do a longitudinal analysis of ratings. 

There is a tendency among some to view rubric rating as a more monological process, but I can't see how this can be supported for most learning outcomes. In my opinion, they are most useful in creating a common language to employ in teaching, to rein in the vast lexicon that might naturally be used and focus on the elements that we agree are the most important. This has positive benefits for everyone concerned.


Thursday, December 01, 2011

Chef's Salad

Here's another serving of link salad. The articles referenced connect to recent topics of discussion.


HERI just released a report on college graduation rates. They give details on regressions to predict completion, and provide the rates of correct classification rates for same. Here's an example:

Note that SAT scores don't add any information once high school GPA is accounted for. The correct classification rate can be compared to the rate of graduates. For example, if a test correctly predicts a coin flip 50% of the time, on the face of it this isn't very impressive. But it's actually more complicated than that. I have a kind of complexity theory approach to this sketched out on scrap paper, and will write about that later. In this case, the rate of four-year graduation from page 7 of the paper is 38.9%, so a correct classification rate of 68.3 could be compared to the strategy of predicting that no student will graduate, which is correct 61% of the time. Even by this crude comparison, the predictor looks useful.

HERI provides an associated calculator that lets you try out different scenarios related to graduation. Very cool.

The Virginia Assessment Group just published their new edition of Research & Practice in Assessment. I hope to be able to read it on the plane tomorrow, on the way to the annual SACS-COC meeting in Orlando. Last time I was there I got to see a shuttle launch, which was amazing. Not likely this time.

Coursekit is new learning management system that wants to be more like social media. This relates to the topic of connecting professional portfolios to a social network. I learned about Coursekit in this Wired Campus article in The Chronicle. Even more intriguing to me is Commons in a Box, a separate open source project to create professional networks. Quoting from the article in The Chronicle:
Educational groups, scholarly associations, and other nonprofit organizations will be able to leverage the Commons in a Box to give their members a space in which to present themselves as scholars to the public, to share their work, to locate and communicate with peers, and to engage in collaborative scholarship.
The original source is the CUNY Academic Commons.