I'm still working on this retention plan, supplying supporting data and statistics. My previous experiments with geo-mapping attrition weren't entirely what I was looking for. I wanted some numbers to assign. So I took a large sample of students who would have had the opportunity to graduate by now, and ran their home cities through the yahoo pipes to geotag them. Then I grabbed that information as JSON formatted data, dumped it into a text file, and used a perl script to extract lon/lat information and their ID (which I'd included). I rounded the lon/lat down to the nearest integer, and found an
atlas that showed the lines.
My perl script calculates graduation rates for each of these regions. Then I tediously marked all this up in Paint (yes, I know... I do have
The Gimp installed, but it didn't seem necessary) as percentages. A bit of the result is shown below.
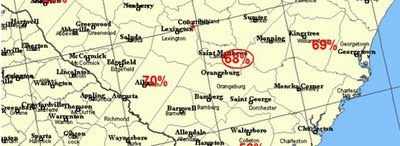
It's not shown on this snippet, but it's fairly obvious from the map that our two biggest markets could stand some improvements in the persistence department. Useful to know, and it's more quantitative that the other maps.
 It's not shown on this snippet, but it's fairly obvious from the map that our two biggest markets could stand some improvements in the persistence department. Useful to know, and it's more quantitative that the other maps.


No comments:
Post a Comment